

This projects demonstrates data analysis of the survivors and perished people from the Titanic tragedy in 1912. The analysis is made with Python, using Pandas library in Jupyter Lab.
1. Data import

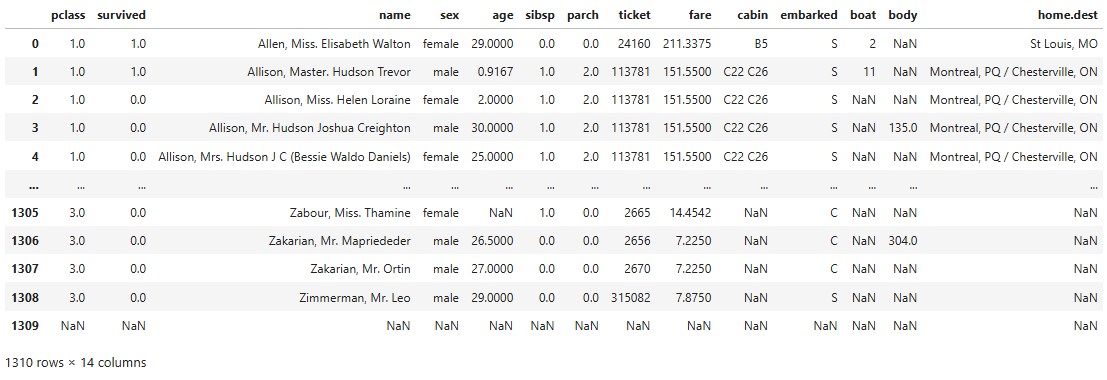
2. Definition of missing data

Observations:
a) A large number of passengers do not have an assigned age – this data will be partially completed using synthetic values (For each individual ticket, I assume it belongs to an adult and assign the age of 30. The number of missing values will drop from 263 to 84).
b) Many passengers also do not have assigned cabins – this data will be omitted.
c) Body numbers will also be omitted, as this data does not contribute anything to the analysis.
d) The destination will also not be analysed, because it has no relevance to survivability or the remaining analyses.
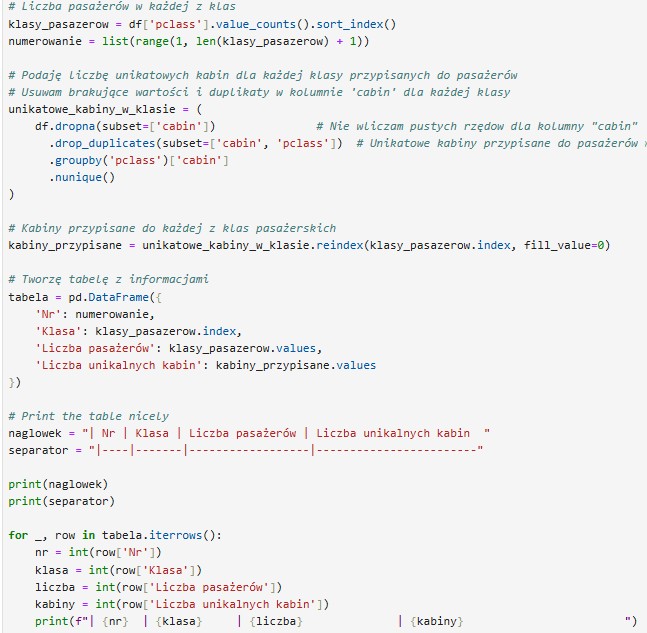
3. Attribution of passengers to cabins according to class:

Observation:
From Wikipedia: first class had 416 cabins, second class had 162 cabins, and third class had 262 cabins.
Despite the large number of cabins in second and third class, only 9 cabins were assigned to passengers in each of these classes.
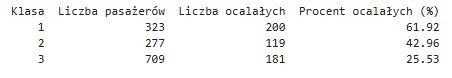
4. Passengers’ stats:

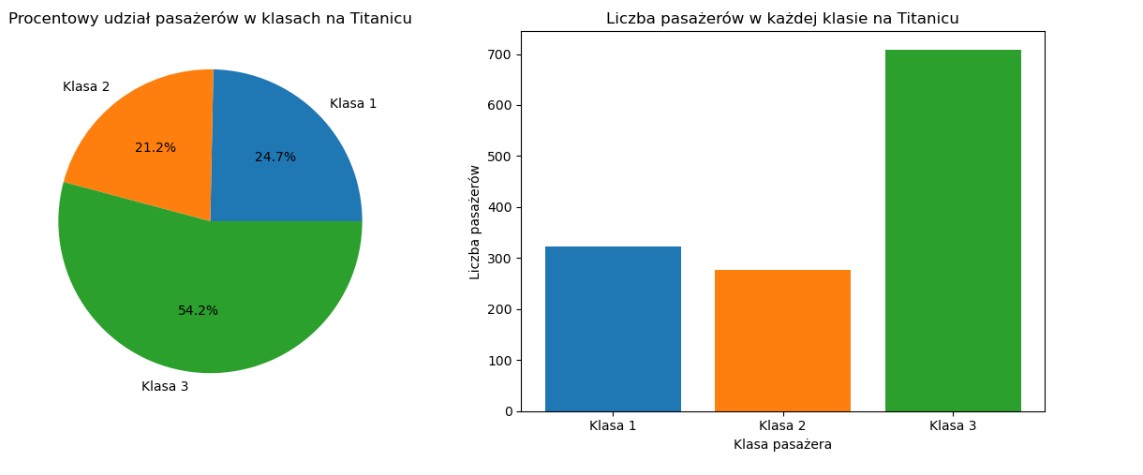
Pie chart: Percentage of passengers in every class
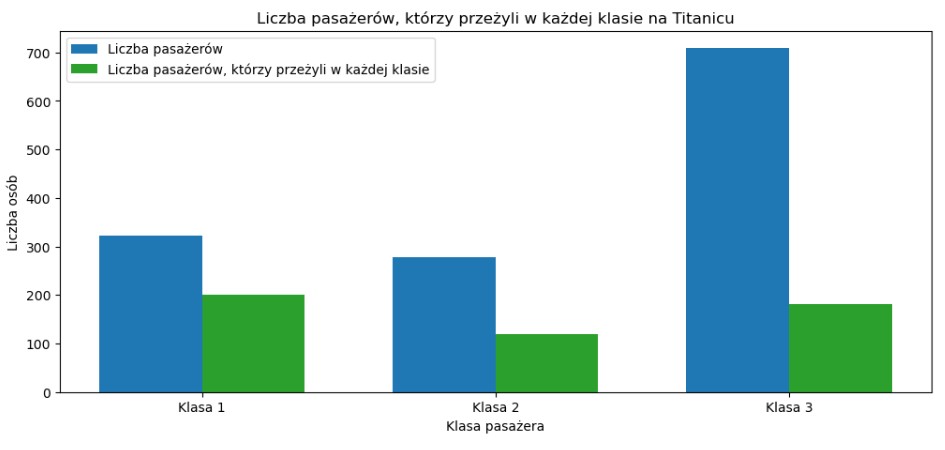
Bar chart: number of passengers in each class
Observation: The largest number of passengers were in third class; third class accounted for over 54% of all passengers.


After filling gaps with synthetic data, the number of missing ages fell from 263 to 84.
10. Analysis of minors’ survival
Using the new data set (with synthetic data), I am able to estimate survival rate of minors below 18 year of age.


For the population below 18 years old almost 70% survivors were girls, but only 37.80% were boys.
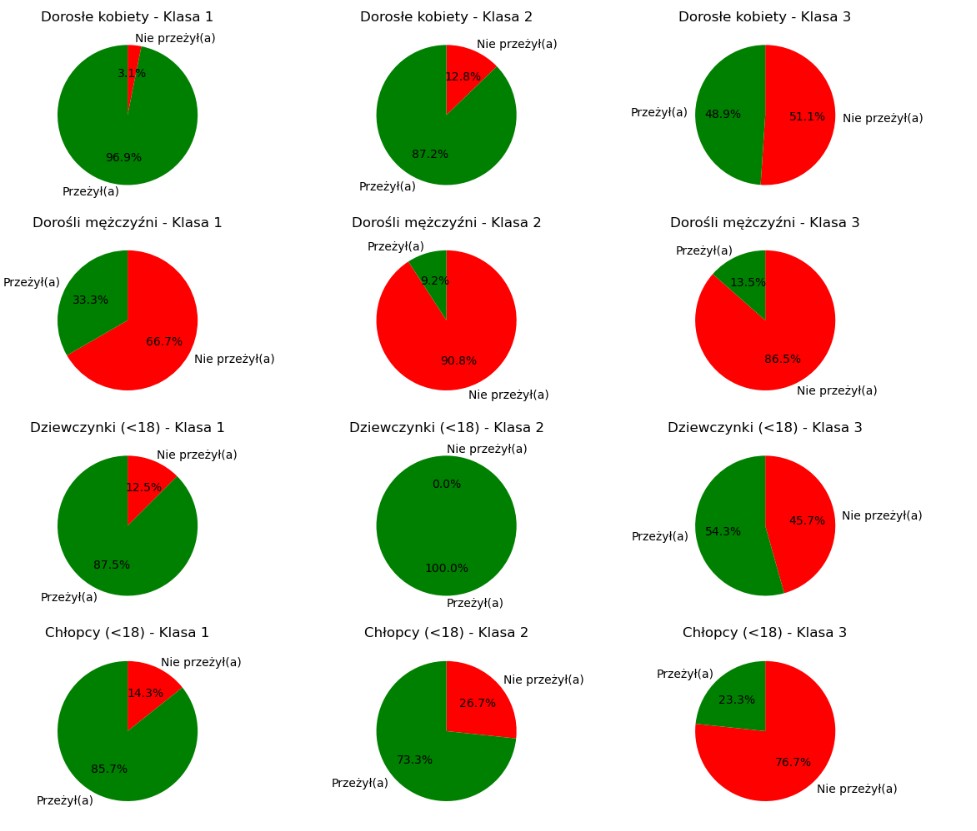
11. Survival rate of adults and children according to the travel class

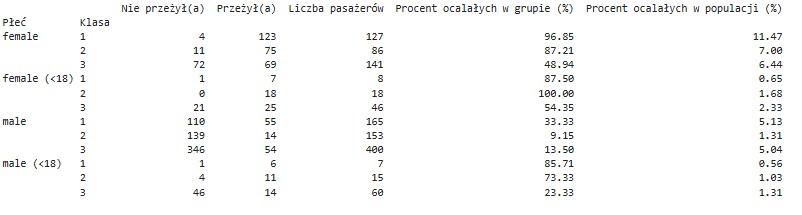
By adding the passengers’ travel class to the survival analysis, we observe that third class was the least fortunate.
Among adult women, only 48.94% survived, and among girls under the age of 18, survival reached just 54.35% (analysis performed using synthetic data).
The survival rate for men in third class was only 13.5%, and just 23.33% for boys under 18, whereas in first class the survival rate for boys was nearly 86%.
An interesting observation is the 33.33% survival rate of men in first class—compared to the other classes—which may suggest that they “bought” their places in the lifeboats.
The lowest survival rate was observed among men in second class.
Unfortunately, this analysis is not complete, as age data is missing for more than 6% of Titanic passengers (even after supplementing the dataset with synthetic data).

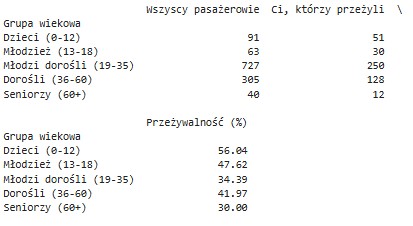
From the complete records, it can be inferred that children under the age of 12 were given priority, followed by youth up to 18 years of age (taking synthetic data into account).
The highest number of adult women survived in first class, while the lowest survival rate was observed in third class.
A high survival rate among girls was seen in first and second class, whereas only slightly more than half of the girls in third class survived.
The highest survival rate among adult men was in first class, and the lowest in second class.
The largest number of boys under 18 who did not survive were in third class.
Unfortunately, more than 6% of the data required for a precise analysis is missing.
12. Correlation table: price of the ticket vs. survival rate

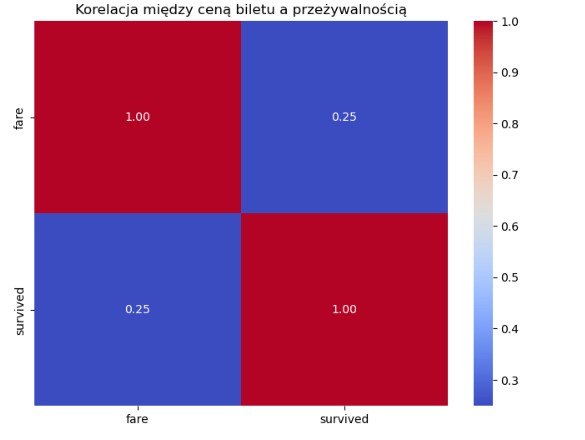
The correlation between ticket price and survival is approximately 0.25.
This indicates a weak but positive relationship, meaning that a higher ticket price is slightly associated with a greater probability of survival.
In practice, passengers who paid more for their tickets had a somewhat higher chance of surviving the disaster.
However, the correlation is relatively small, which suggests that ticket price is not a key factor determining survival—other factors may have played a more important role (such as class, age, and gender).
13. Correlation table: passenger class vs. survival rate

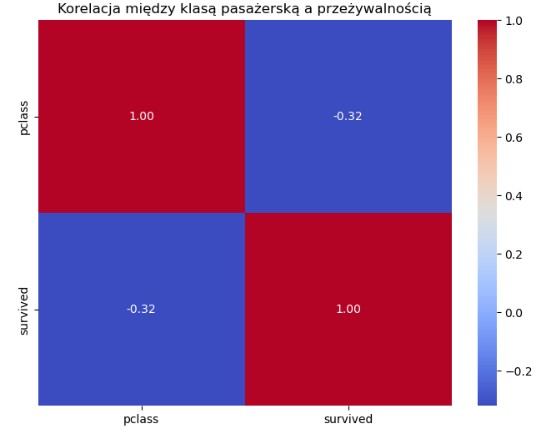
The correlation between passenger class and survival is approximately –0.32.
This is a moderate negative correlation, which means that as the passenger class number increases (where pclass goes from 1 to 3, with 1 being the highest class), the probability of survival decreases.
In practice, passengers in higher classes (e.g. first class) had significantly better chances of survival than those in lower classes (e.g. third class).
The negative correlation shows that travel class was an important factor influencing survival during the Titanic disaster.
This is consistent with historical records — first-class passengers had better access to lifeboats and rescue resources.
14. Correlation table: gender vs. survival rate

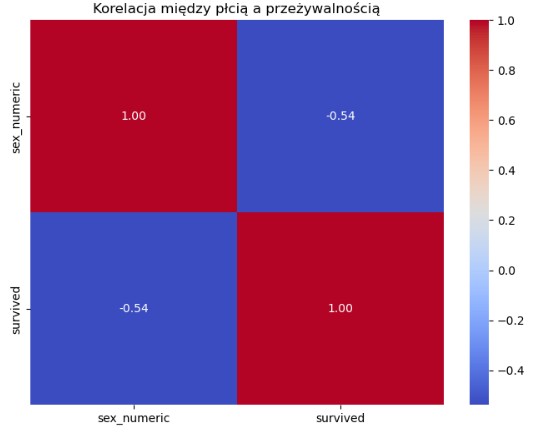
The correlation is moderately strong and negative.
This means that as the value of sex_numeric increases (i.e. moving from women to men), the probability of survival decreases.
In other words, women had higher chances of survival than men on the Titanic.
The negative sign of the correlation confirms a well-known historical fact: women were more likely to survive than men.
15. Survival analysis of children and adults according to ticket price

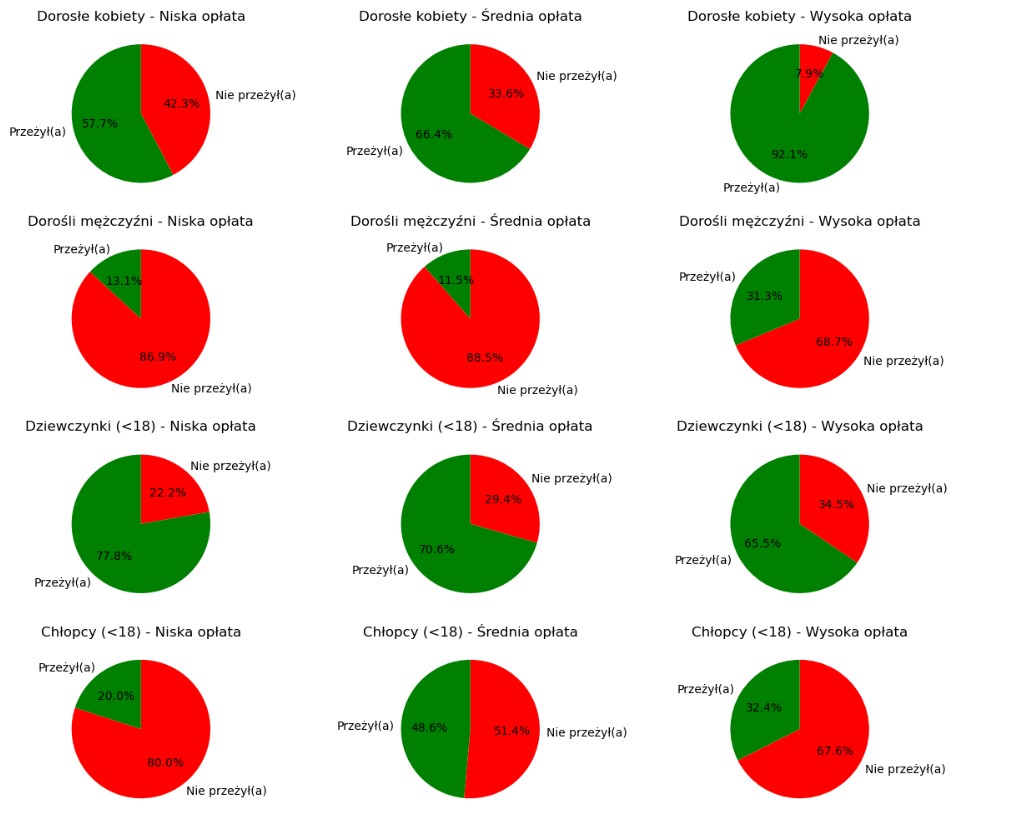
Women who paid the highest ticket prices had the greatest chances of survival — over 92% of women who purchased tickets in the third, most expensive price range survived.
Despite the high ticket price, only 31.3% of adult men survived. However, this result was more than twice as high as for adult men with the cheapest tickets and almost three times higher compared to those with tickets in the middle price range.
Ticket price did not have a significant impact on the survival of girls under 18 years of age.
The fewest boys survived in the group with cheap tickets, although mortality was also high in the high-price ticket range.
The data are incomplete — information on age is missing for over 6% of the population.

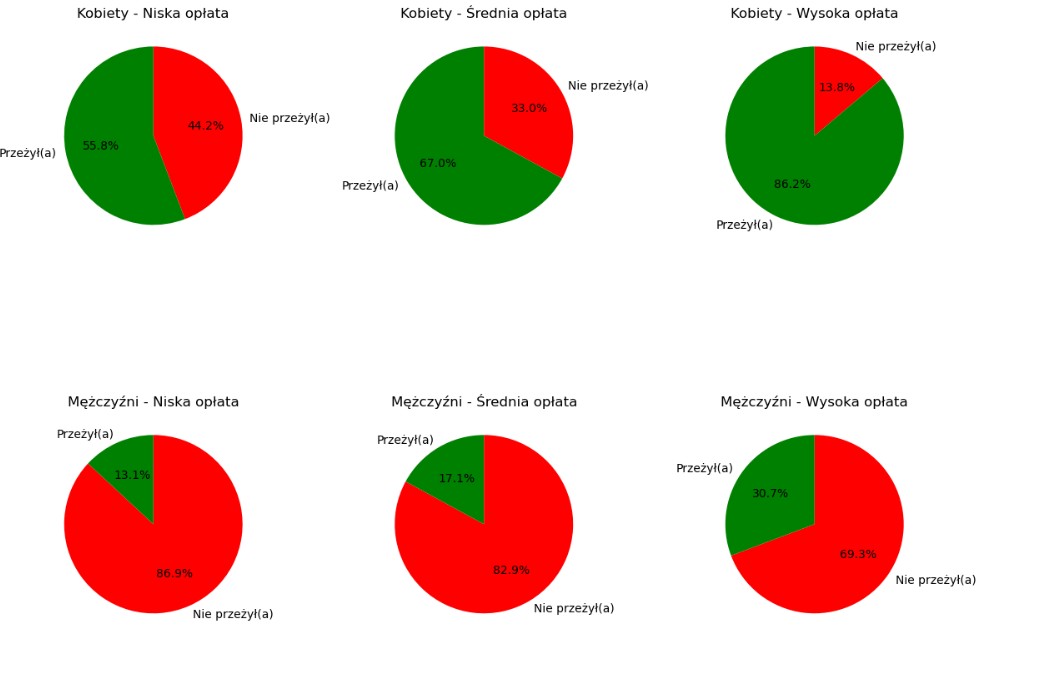
If we consider gender alone, it turns out that both women and men who paid the highest ticket prices had the greatest chances of survival.
16. Survival rate according to the number of family members
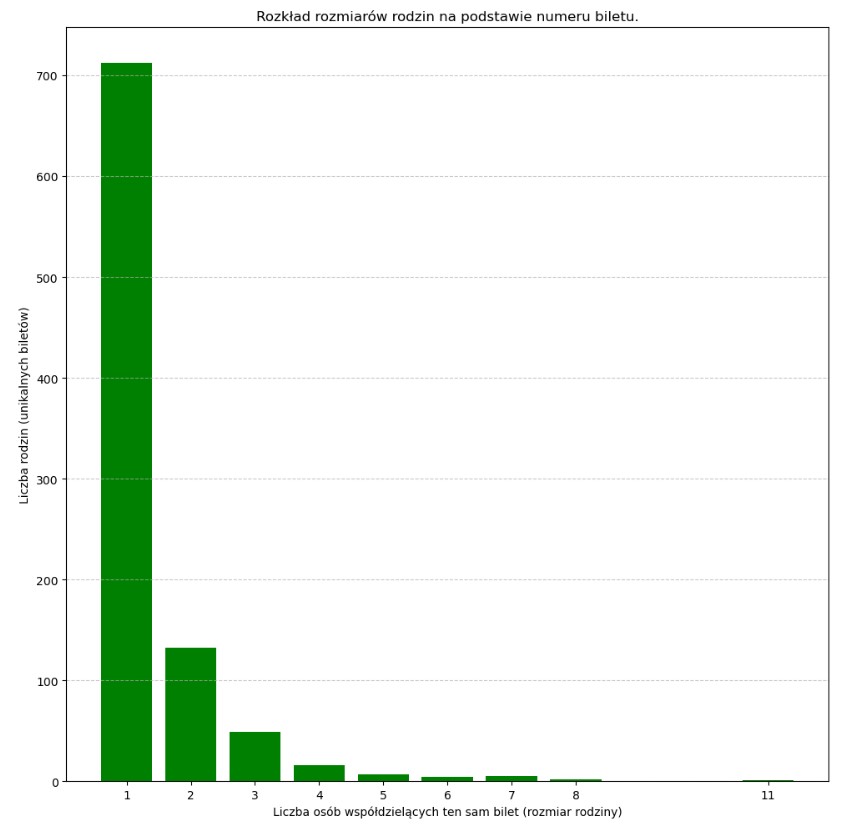
The vast majority of passengers travelled alone. Only a small number of families consisted of 5, 6, 7, or 8 members, and one family had as many as 11 people.

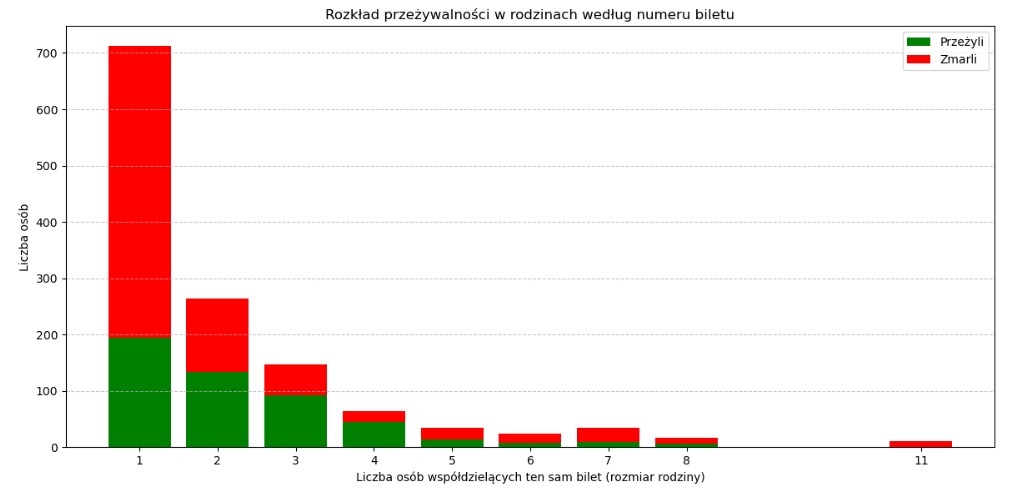
In the case of large families, survival rates were negligible — which can be explained by strong emotional bonds, a sense of belonging, and attempts to save as many family members as possible until the very last moment.
The high mortality rate among passengers traveling alone can be explained by the fact that most of them were in third class, which had limited access to evacuation.
The table below illustrates the survival percentages of solo travellers in each passenger class.

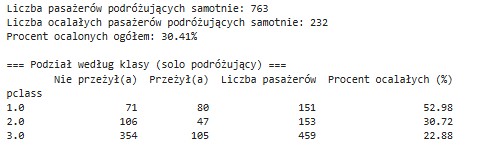
Once again, this confirms that passengers traveling in first class had a higher chance of survival.
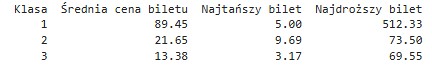
17. Survival rate according to the ticket price group

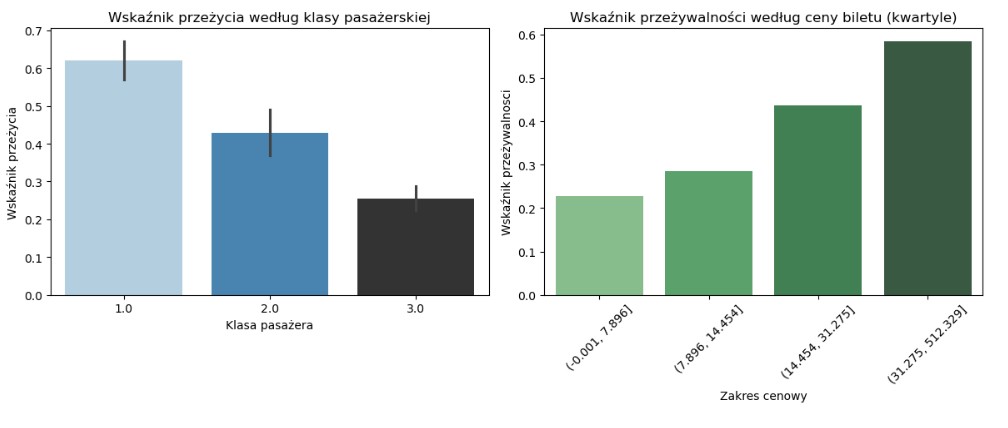
Conclusion: The better the passenger class, the higher the chances of survival: for first class, the average survival rate was over 60%, while for third class it was below 30%.
A similar pattern is observed for ticket price: the higher the ticket price, the greater the chance of survival.
18. Bodies found or not according to the passenger class and gender

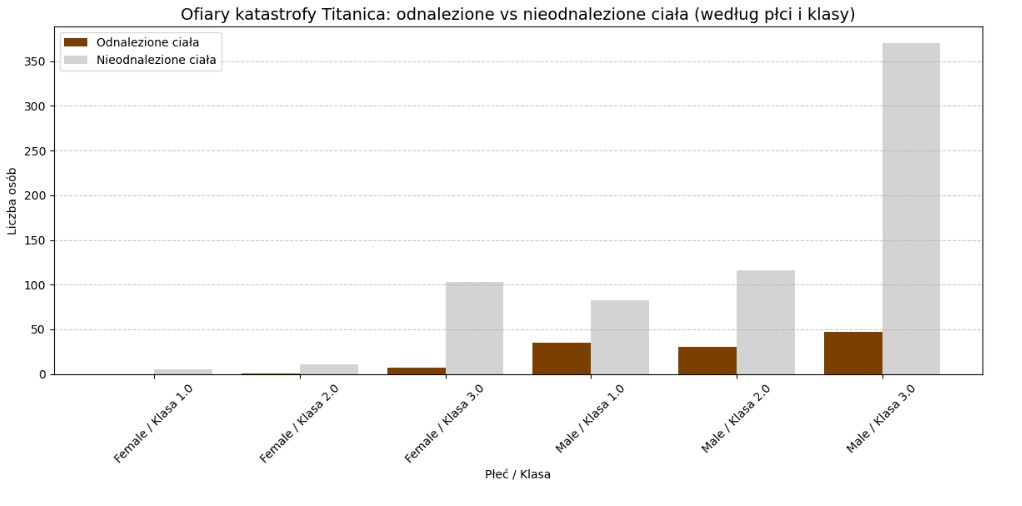
There is a small proportion of unrecovered bodies among women traveling in first and second class, whereas in third class the number of unrecovered bodies increases dramatically.
Among men, the number of recovered bodies is around 40 for first and second class and close to 50 for third class.
The number of bodies that were not recovered is significantly higher than among women (see previous analyses) and ranges between 75 and 120 for first and second class, while for third class it reaches nearly 350 (limited access to lifeboats due to the location of the cabins).
Additional factors should also be taken into account, such as:
-
night time conditions (the Titanic struck the iceberg at 11:40 p.m.),
-
water temperature (the water temperature was −2°C, below the freezing point of seawater—approximately −1.8°C—making survival virtually impossible even for a short time),
-
and the time from collision to complete sinking: 2 hours and 40 minutes.
19. Embarkation by class and harbour

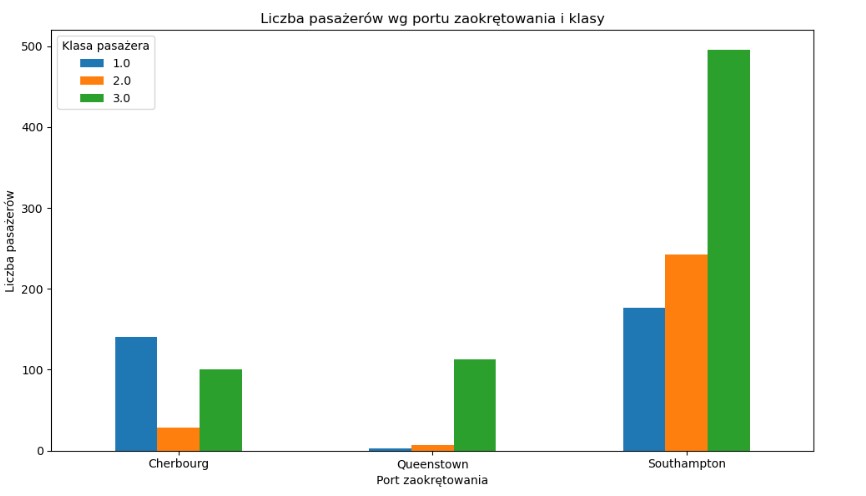
The highest number of first-class passengers boarded in Southampton. This port was also where the largest number of third-class passengers embarked. In Cherbourg, the European elite boarded the ship, mostly traveling in first class.
20. Passengers who didn’t get to the life boats
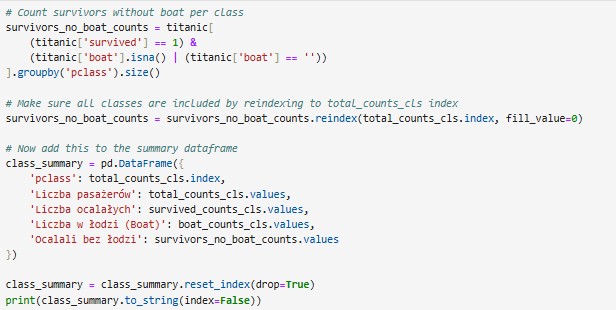
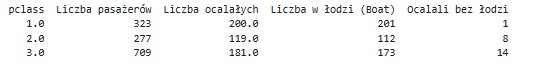
Observation: 23 passengers survived despite not being assigned to any lifeboat. Historical sources indicate that no one could survive in the icy water for more than 30 minutes; therefore, all those who survived without an assigned lifeboat must have been pulled from the water by one or two rescue boats.
Conclusion: If Leonardo DiCaprio had learned how to swim before boarding the Titanic, he would have had a chance to survive.