

A build of 4 separate KPI dashboards for Duralex: Gazette – a snapshot of the current situation, E-merchandising, Customer experience – sales funnel, Demographic and Geolocation.
I have been mandated to build 4 separate dashboards for the brand Duralex. Time of the build: 5 days
Those dashboards are built on Looker (which is a part of Google family) and take data from GA4. Since March 2023, there is a possibility to link Shopify with GA4 and send transactional data, before this transfer was only possible with an expensive plugin.
Here are the dashboards I have built:
Gazette
A snapshot of the moment.
1. Revenue and traffic
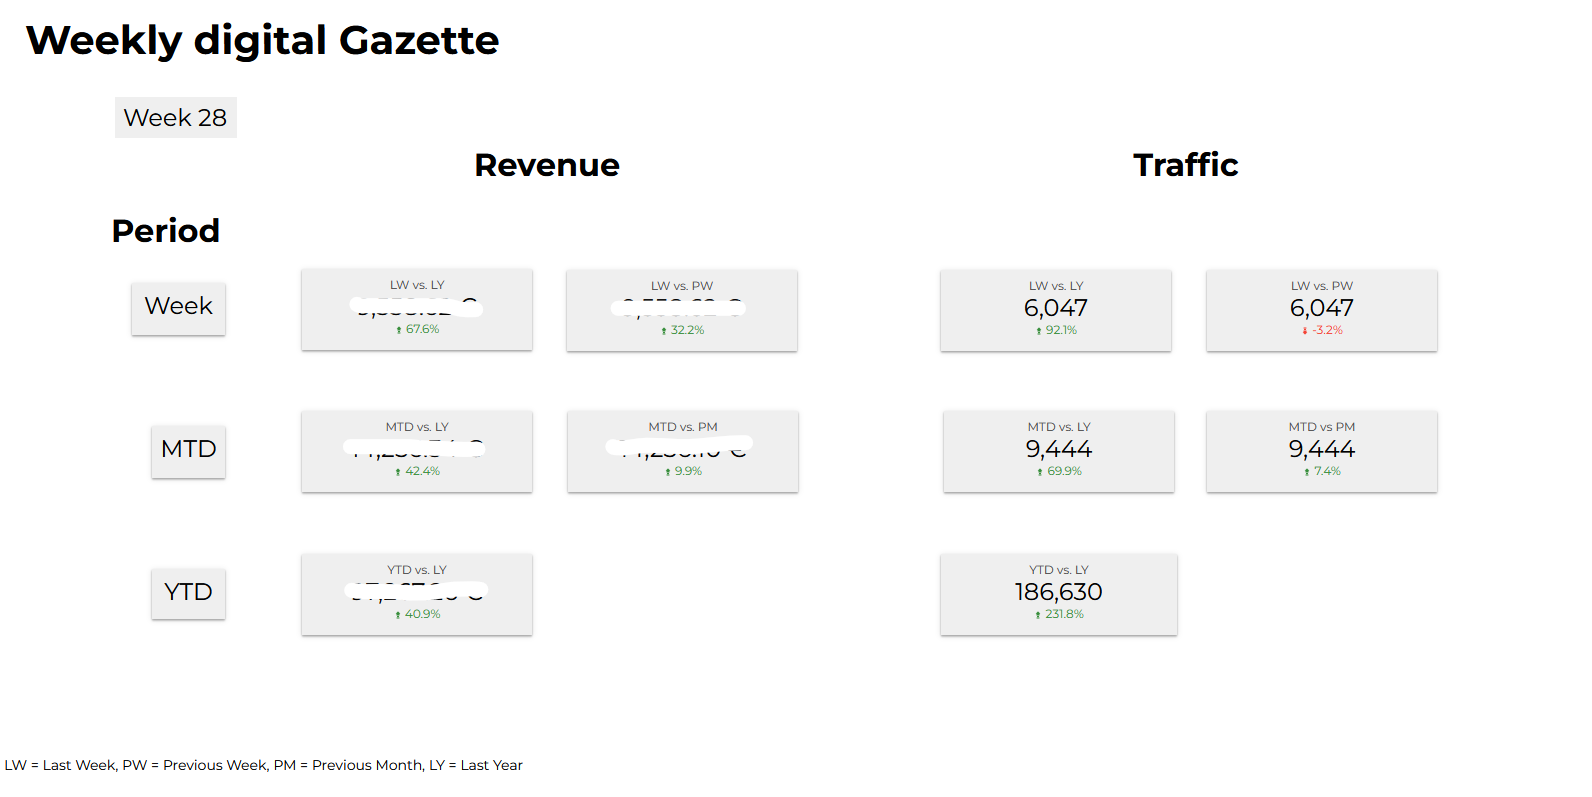
The first page displays revenue of the last week in the comparison to the same week of the last year, and the revenue from the last week in the comparison to the week before.
The second line displays values of the Month to Date in the comparison to the same month of the previous year and the same period (in days) from the previous month.
The last line shows the total revenue in the scale year to Date, in the comparison to the revenue generated in the same period of the last year.
Green and red values indicate growth or drop of compared period.
On the top of the page indication of the week of the year.
The second column shows changes in traffic for the same periods: week, Month To Date and Year To Date, in the comparison to respective periods.
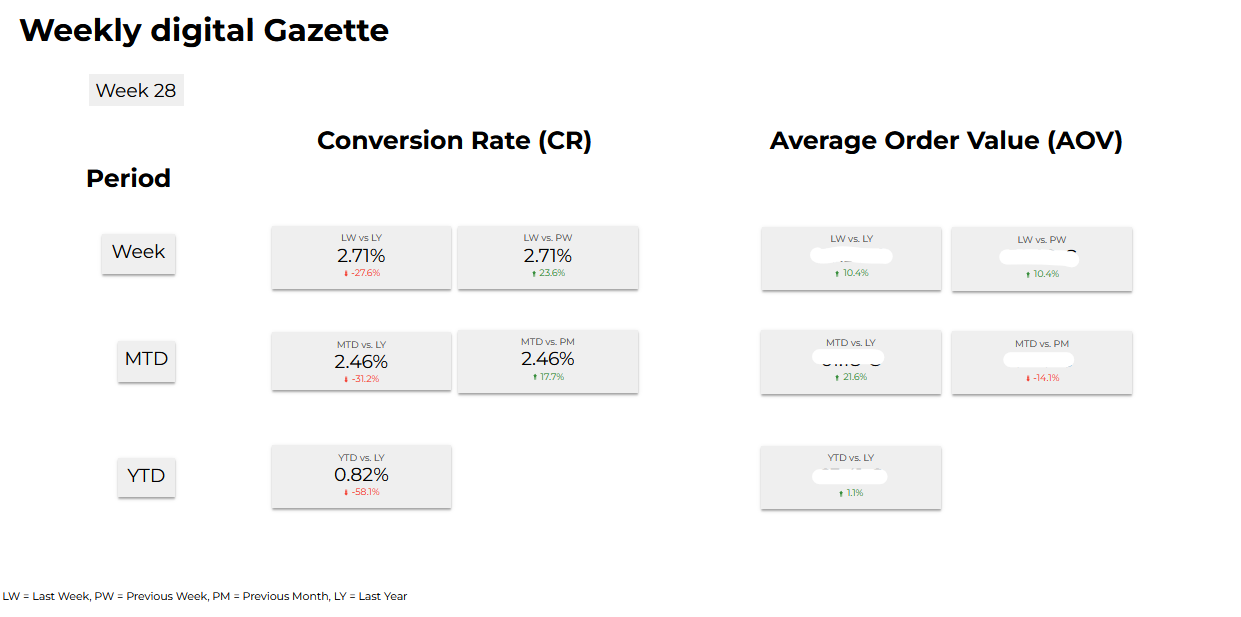
2. Conversion Rate and Average Order Value
The following page shows the level of Conversion Rate (CR), calculated as a function of:
CR = transactions / sessions
and Average Order Value (AOV), calculated as a function of
AOV = item revenue / transactions
3. Units per Transaction and Unit Price
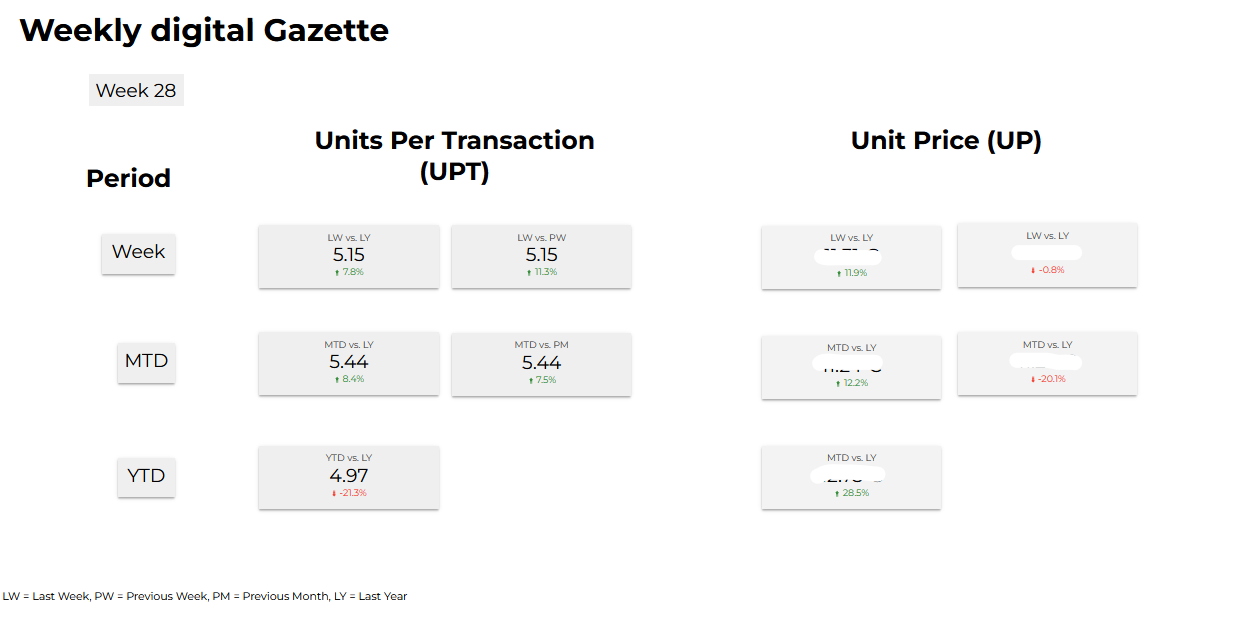
Those two values are calculated as functions:
UPT = item purchase quantity / transactions
and
UP = item revenue / item purchase quantity
4. Revenue, Traffic, CR, AOV, UPT and UP: flexible date range
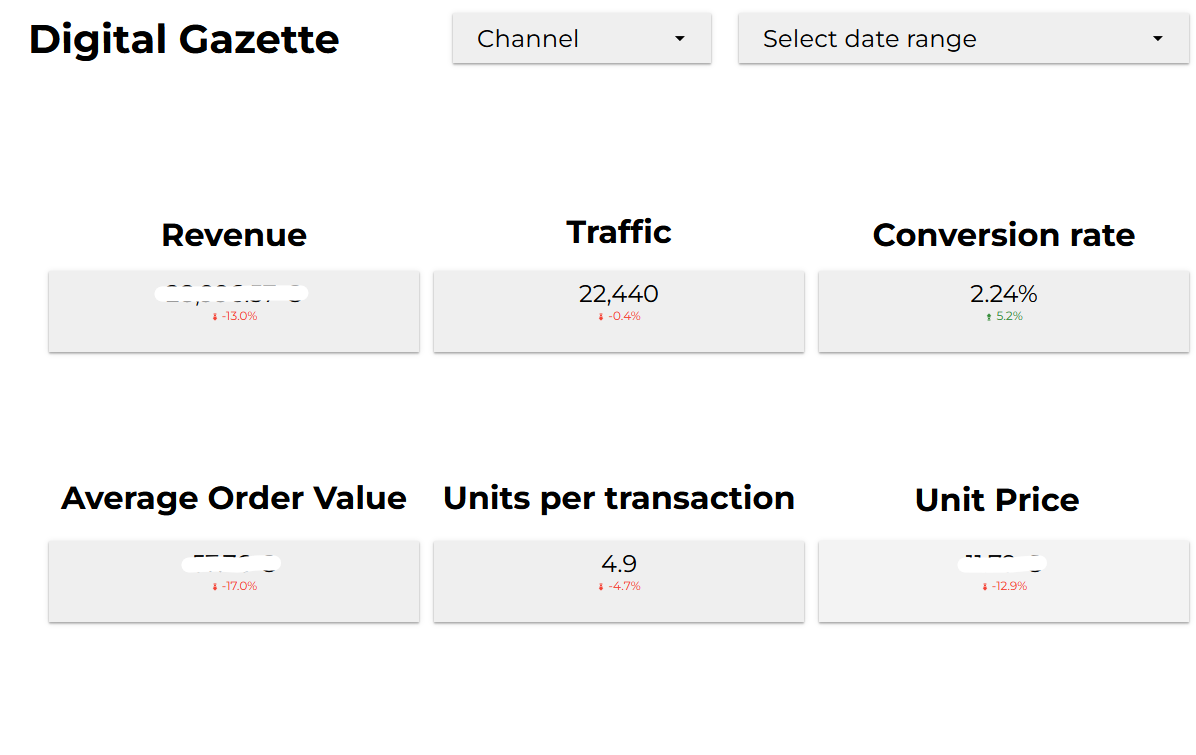
The values can be displayed in the flexible date range: comparison will be made with the previous period in the same number of days. In example: if the date range is 22 May 2023 – 17 June 2023, the comparison will be made with the period of 22 April – 17 May of the same year.
Additionally I added a filter, where transactions can me displayed in the function of the channel: organic search, direct, referral, paid search, organic social and so on.
5. Item revenue, conversion rate, traffic and transactions
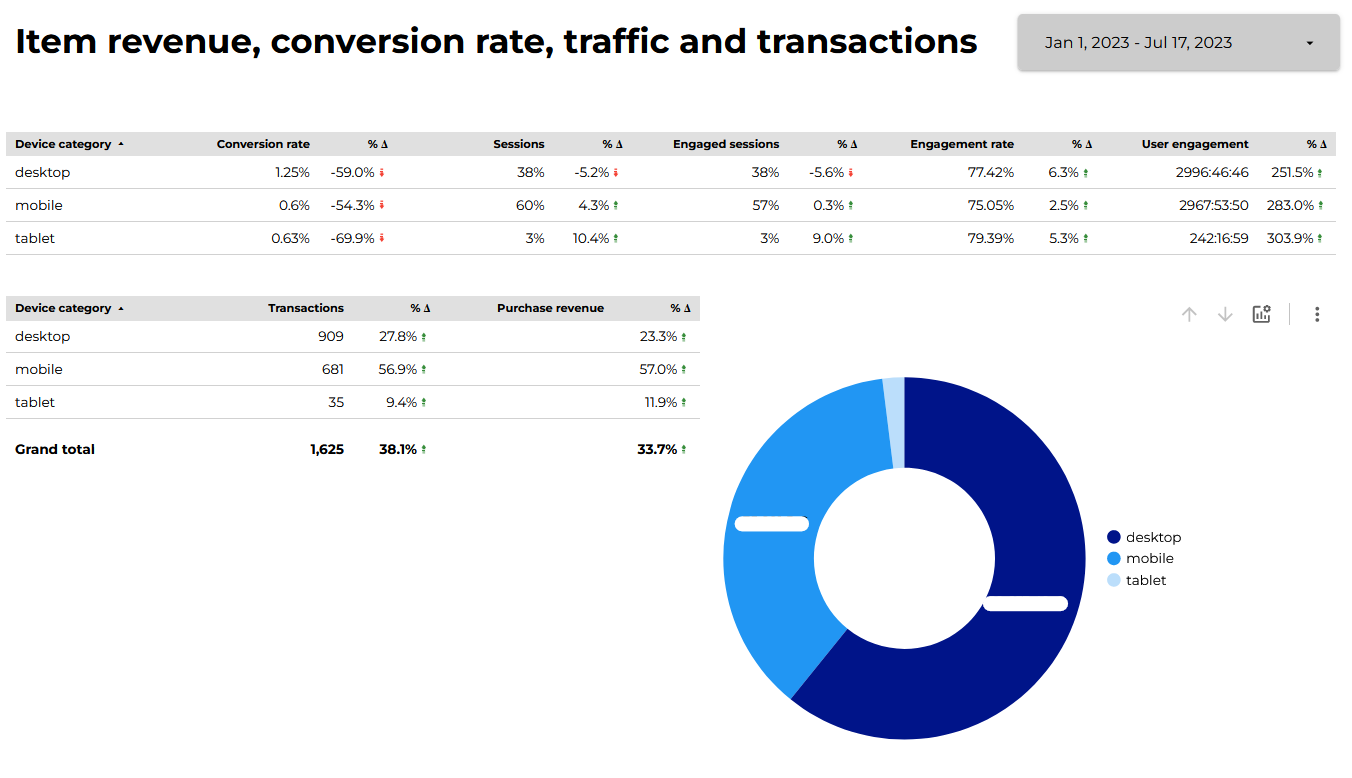
This analytics demonstrates conversion rate according to the type of device (desktop, mobile, tablet), percentage of sessions, percentage of engaged sessions (more than just an entry), engagement rate and the number of hours spent in total per device in a given time period.
The second table depicts the number of transactions and the purchase revenue generated (hidden due to the confidentiality reasons).
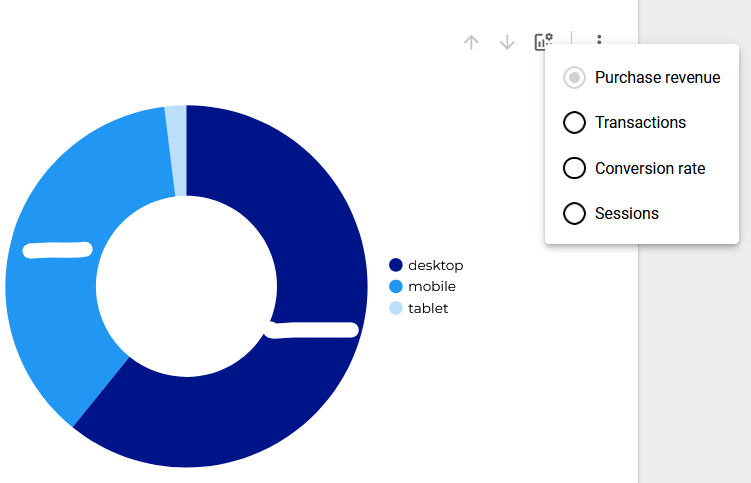
The graph is multi-functional: can display purchase revenue, number of transactions, conversion rate per device and number of sessions.
7. Conversion rate: the graph
The following metric depicts the conversion rate:
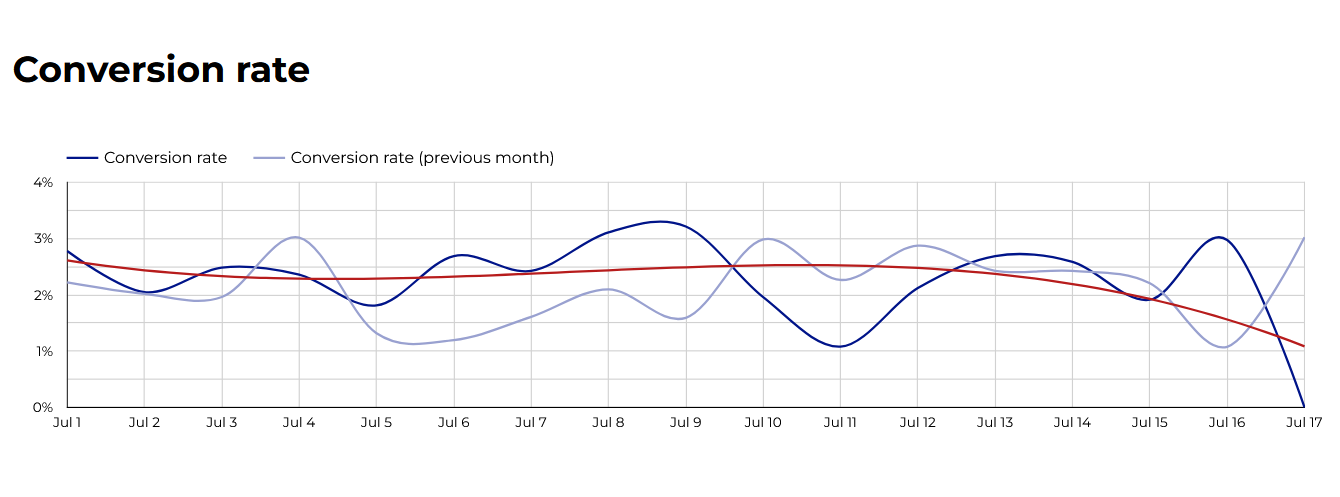
As on the previous page, it has been calculated from the formula
CR = transactions / sessions
8. Top product performance
This particular table raises a particular interest of commanding heights, as displays immediately the best performing products in a given data range (revenue hidden due to confidentiality reasons):
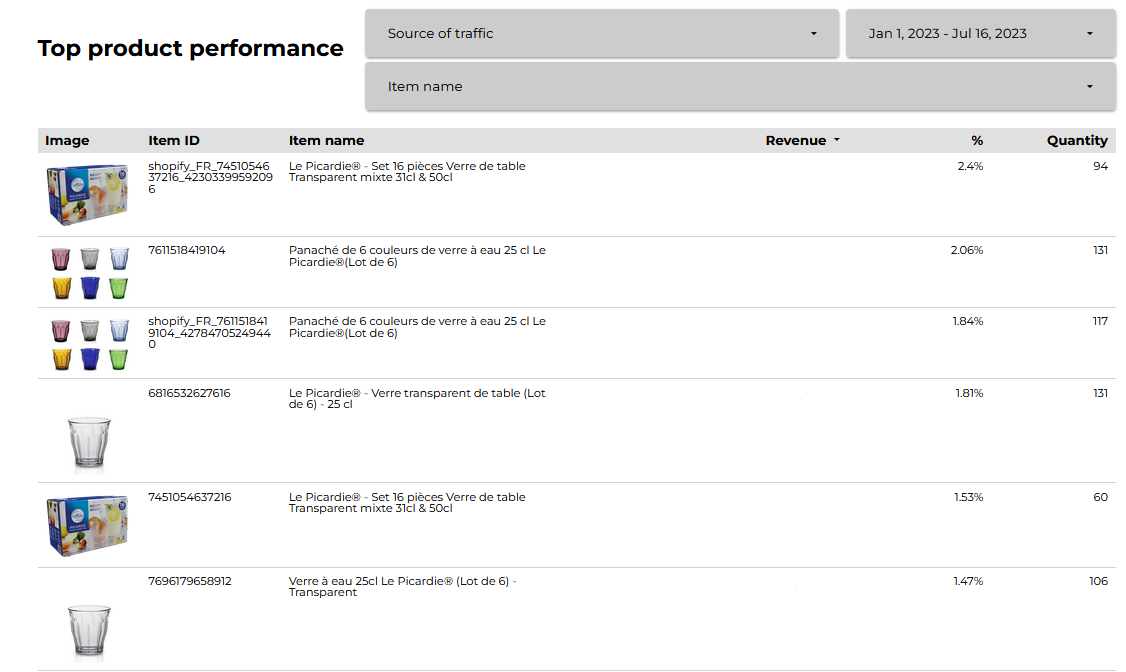
Two data sets are matched using the item ID field. Additional filters have been added to narrow down the performance according to the source of traffic and extract a particular item.